
Where Do Most Car Accidents Happen In The UK?


Most car accidents in the UK happen on urban roads, but rural roads are far more deadly. In 2024, there were 1,602 reported road deaths across Great Britain, with over 27,000 people seriously injured.
Urban areas see more collisions because they carry more traffic, particularly during peak hours. Rural roads account for fewer incidents overall, but a disproportionate share of fatal crashes.
This guide breaks down accident locations, casualty figures, and the risk factors behind the numbers, using data from the Department for Transport’s 2024 annual report and provisional 2025 figures.
Urban roads see the most crashes, but rural roads are far more deadly. Speeds are higher, barriers are rare, and ambulances take longer to arrive. Yet living rurally doesn’t automatically mean cheaper premiums, because insurers weigh multiple postcode factors beyond just accident rates.
Make sure your cover matches where you actually drive when you compare car insurance quotes.
- What types of roads see the most car accidents?
- Which road users are most affected by accidents?
- Where in the UK are car accidents most common?
- Why do so many car accidents happen on urban roads?
- Why are rural roads more dangerous?
- What are the most common risk factors in UK car accidents?
- Have car accident rates improved in recent years?
- How does this affect your car insurance?
- Frequently asked questions (FAQs)
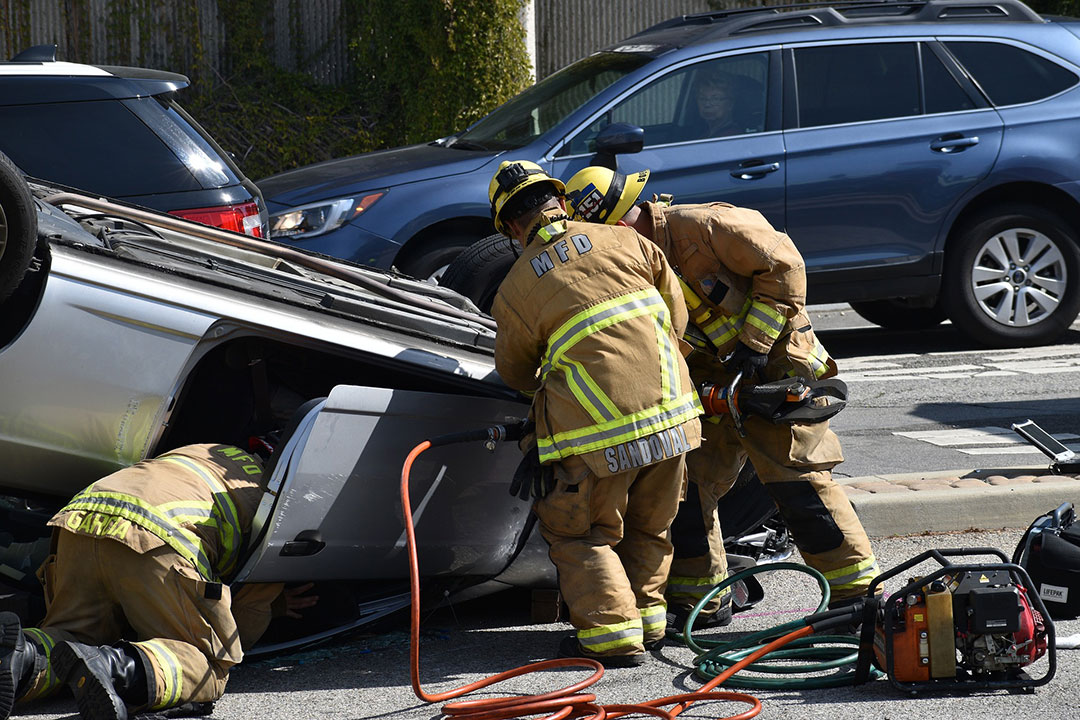
What types of roads see the most car accidents?
Urban roads see the most collisions, while rural roads produce the most fatalities. The difference comes down to speed, not frequency.
Urban roads
Towns and cities see more day-to-day crashes because they carry the heaviest traffic. Junction-heavy layouts, pedestrians, cyclists, and stop-start driving all increase collision risk.
Speeds are lower, so these crashes tend to cause fewer deaths. But they still account for a large share of serious injuries, particularly to pedestrians and cyclists.
Rural roads
Rural single carriageways are the most dangerous road type per mile driven. National speed limits of 60 mph apply even on narrow, unlit roads with sharp bends and no central barriers.
When crashes happen on these roads, they’re more likely to involve head-on collisions or vehicles leaving the road. Emergency response times are also longer, which increases the severity of outcomes.
Motorways
Despite higher speeds, motorways are statistically the safest road type. Divided carriageways, controlled access, and fewer junctions all reduce collision risk.
When motorway crashes do happen, they tend to be severe due to the speeds involved. But the overall fatality rate per billion vehicle miles is far lower than on rural roads.
Which road users are most affected by accidents?
Car occupants are the most commonly killed and seriously injured road users in the UK, followed by pedestrians, motorcyclists, and cyclists.
2024 fatalities by road user type
| Road user type | Deaths (2024) | Change from 2023 |
| Car occupants | 692 | Down 5% |
| Pedestrians | 409 | Up 1% |
| Motorcycle users | 340 | Up 8% |
| Cyclists | 82 | Down 6% |
| Other (bus, van, HGV) | 79 | Down 14% |
Who faces the highest risk per journey?
Motorcyclists face the highest risk relative to their share of road traffic. They’re particularly vulnerable on rural routes where speeds are higher and there’s less protection.
Pedestrians and cyclists are most at risk in urban areas. Turning traffic, blind spots, and driver inattention cause the majority of collisions involving these groups.
If you’re involved in a collision as any road user, knowing what to do after an accident can make a real difference to the outcome.
Where in the UK are car accidents most common?
England records the highest number of road casualties each year, reflecting its larger population and denser road network. But Wales and Scotland see more fatal outcomes per incident due to their rural road networks.
Casualties by UK nation (2023, latest regional breakdown)
| Region | Road deaths | Serious injuries | Total casualties |
| England | 1,370 | 24,878 | 122,832 |
| Wales | 101 | 1,278 | 4,344 |
| Scotland | 153 | 1,931 | 5,801 |
| Northern Ireland | 71 | 880 | 7,985 |
Regional patterns
Parts of Wales and rural Scotland have higher fatality rates per capita. This reflects the dangers of narrow, winding roads with limited safety infrastructure.
Northern Ireland publishes its own figures separately. The 2024 data shows a continued gradual decline, broadly in line with trends across the rest of the UK.
Why do so many car accidents happen on urban roads?
Urban roads concentrate the most traffic, pedestrians, cyclists, and junctions into the smallest space. This creates more opportunities for collisions, even at lower speeds.
Common urban accident types
Rear-end shunts in traffic queues are the most frequent urban crash type. Cars turning into the path of motorcycles or cyclists account for a large share of serious injuries.
Vehicles pulling out from side streets and delivery vans stopping suddenly are also common causes. School zones and high streets are particular hotspots during peak hours.
Roundabouts and multi-lane junctions create confusion, especially for less experienced drivers. Pedestrians crossing unexpectedly between parked cars add another layer of risk.
Why urban crashes are less deadly
Lower speed limits mean less force on impact. Faster emergency response times in built-up areas also improve survival rates.
But urban crashes still cause thousands of serious injuries each year, particularly to vulnerable road users. A low-speed collision with a pedestrian or cyclist can still cause life-changing harm.
Why are rural roads more dangerous?
Rural roads produce fewer crashes overall but a disproportionate share of fatalities. Higher speeds, tighter bends, and longer emergency response times all increase the severity.
Speed and road design
The national speed limit of 60 mph applies to most single carriageways, even when the road is narrow, unlit, or full of bends. Many drivers travel at or near this limit regardless of conditions.
When a vehicle leaves the road at these speeds, it’s likely to hit a tree, ditch, or wall. Head-on collisions on roads without central barriers are also common.
Emergency response
Rural locations often have limited mobile phone signal, which delays 999 calls. Ambulance response times are longer, and the nearest trauma centre may be over an hour away.
Fewer bystanders means less chance of immediate first aid. These factors combined explain why rural crashes are more likely to be fatal.
Weather and seasonal factors
Rural roads are more affected by ice, flooding, and fallen leaves than urban routes. Council gritting schedules prioritise main roads, leaving rural lanes untreated.
Winter months see a spike in rural fatalities as darkness falls earlier and road surfaces deteriorate. Drivers unfamiliar with local conditions are at particular risk.
What are the most common risk factors in UK car accidents?
Speeding, not wearing a seatbelt, and driving at night are among the leading contributors to fatal UK road accidents. Male drivers account for a disproportionate share of serious collisions.
Key statistics
| Risk factor | Impact |
| Speeding | Consistently linked to around 1 in 4 road deaths |
| No seatbelt (night-time) | Around a quarter of car occupant fatalities were unbelted |
| Male road users | 76% of all people killed on UK roads in 2024 |
| Young drivers | Overrepresented in high-impact crashes |
Overlapping risks
These factors often combine. Male drivers are more likely to speed, drive at night, and take risks on rural roads.
Distracted driving is another growing concern, particularly in urban areas. Using a phone while driving carries a penalty of 6 points and a £200 fine, or disqualification for new drivers.
Alcohol and drugs
Drink and drug driving remain significant factors, especially at night and on weekends. The THINK! campaign continues to target these behaviours through public awareness.
Have car accident rates improved in recent years?
Yes. UK road fatalities and total casualties have declined year-on-year, though serious injuries have remained stubbornly stable.
2024 annual figures
The 2024 annual report recorded 1,602 road deaths in Great Britain, 29,467 killed or seriously injured, and 128,272 total casualties.
That’s a 1% drop in fatalities and a 4% fall in total casualties compared to 2023. It’s the lowest fatality count outside of pandemic-affected years.
Provisional 2025 data
Figures for the 12 months ending June 2025 show an estimated 1,579 fatalities, down a further 3%. The downward trend is continuing, but serious injuries remain stubbornly high.
This suggests that while fewer crashes are proving fatal, many that occur are still causing lasting harm.
Long-term context
UK road deaths peaked at nearly 8,000 in 1966. Better vehicle design, seatbelt laws, drink-driving enforcement, and speed cameras have driven the decline since.
But the rate of improvement has plateaued since 2010. Further progress will likely depend on wider adoption of autonomous safety features and continued investment in road infrastructure.
What’s driving the improvement?
Better vehicle safety technology, road design improvements, and enforcement of driving offences all contribute.
But behavioural factors like speeding and seatbelt use haven’t changed much, especially among high-risk groups. The DfT’s road safety statistics collection tracks these trends year by year.
How does this affect your car insurance?
Where you live and drive directly influences your car insurance premium. Urban areas with higher accident rates often mean higher premiums, while rural postcodes can go either way.
Location and risk
Insurers use postcode data to assess local accident rates, theft risk, and claim frequency. Living in a city centre typically costs more than a rural village, despite rural roads being more dangerous per journey.
How claims history plays a role
If you’re involved in a collision, even one that wasn’t your fault, it could affect your premium at renewal. Understanding write-off categories helps you know what to expect if your vehicle is damaged beyond repair.
Being hit by an uninsured driver can complicate matters further. Comprehensive policies with an uninsured driver promise offer the best protection.
Reducing your premium
Fitting a black box telematics device can prove you’re a safe driver regardless of where you live. Building up a strong no-claims bonus also helps keep costs down.
Choosing the right level of cover matters too. A comprehensive policy protects you in more scenarios, which can work out cheaper than third-party only.
Keeping your vehicle well maintained with a valid MOT ensures your car meets safety standards. Insurers may question claims on vehicles with expired MOTs.
Frequently asked questions (FAQs)
Rural single carriageways are the most dangerous per mile driven. High speeds, poor lighting, and limited visibility all contribute to their disproportionate share of fatal crashes.
Yes. Despite higher speeds, motorways are statistically safer because of divided lanes, controlled access, and fewer sharp bends or junctions.
More accidents happen in urban areas due to heavier traffic. But these crashes tend to be less serious than those on high-speed rural roads.
Young male drivers are statistically the most likely to be involved in serious or fatal accidents. Night-time driving and rural roads increase the risk further.
Fatalities and total casualties have declined in recent years. But serious injuries have plateaued, suggesting that crashes that do happen are still causing severe harm.
Higher speeds, narrow roads without barriers, and longer emergency response times all increase the chance of a fatal outcome.
England records the most road casualties each year, largely due to its population size and traffic density. But parts of Wales and Scotland have higher fatality rates per capita.
Yes, insurers use your postcode to assess local accident rates and claim frequency. Urban areas with higher traffic volumes typically carry higher premiums.