
UK Car Accident Statistics


In 2024, there were 1,602 reported road deaths in Great Britain and over 128,000 total casualties. That works out to roughly four people killed and more than 80 seriously injured every day.
Road safety in the UK has improved over recent decades, but the daily toll remains high. Serious injuries have stayed stubbornly consistent even as fatalities have fallen.
Behind every number is a real person affected by a collision that may have been preventable. Understanding the data helps drivers, insurers, and policymakers focus on what actually reduces harm.
This guide breaks down the latest figures from the DfT Reported Road Casualties GB 2024 report, covering causes, demographics, regional patterns, and long-term trends.
Four people are killed on UK roads every day, and the most common cause isn’t speed or alcohol, it’s simply failing to look properly (38% of all collisions). Fatalities have fallen 34% over the past decade, but serious injuries have barely moved, meaning crashes are still causing lasting harm at the same rate.
Factor in where and how you drive when you compare car insurance quotes, especially if you use rural roads where 58% of deaths occur.
- What do the latest UK car accident statistics show?
- What are the leading causes of car accidents in the UK?
- Which road users are most at risk?
- How do age and gender affect road safety?
- Where in the UK do the most accidents happen?
- How have UK road accident rates changed over time?
- How does the UK compare to other countries?
- What measures are being taken to improve road safety?
- Frequently asked questions (FAQs)
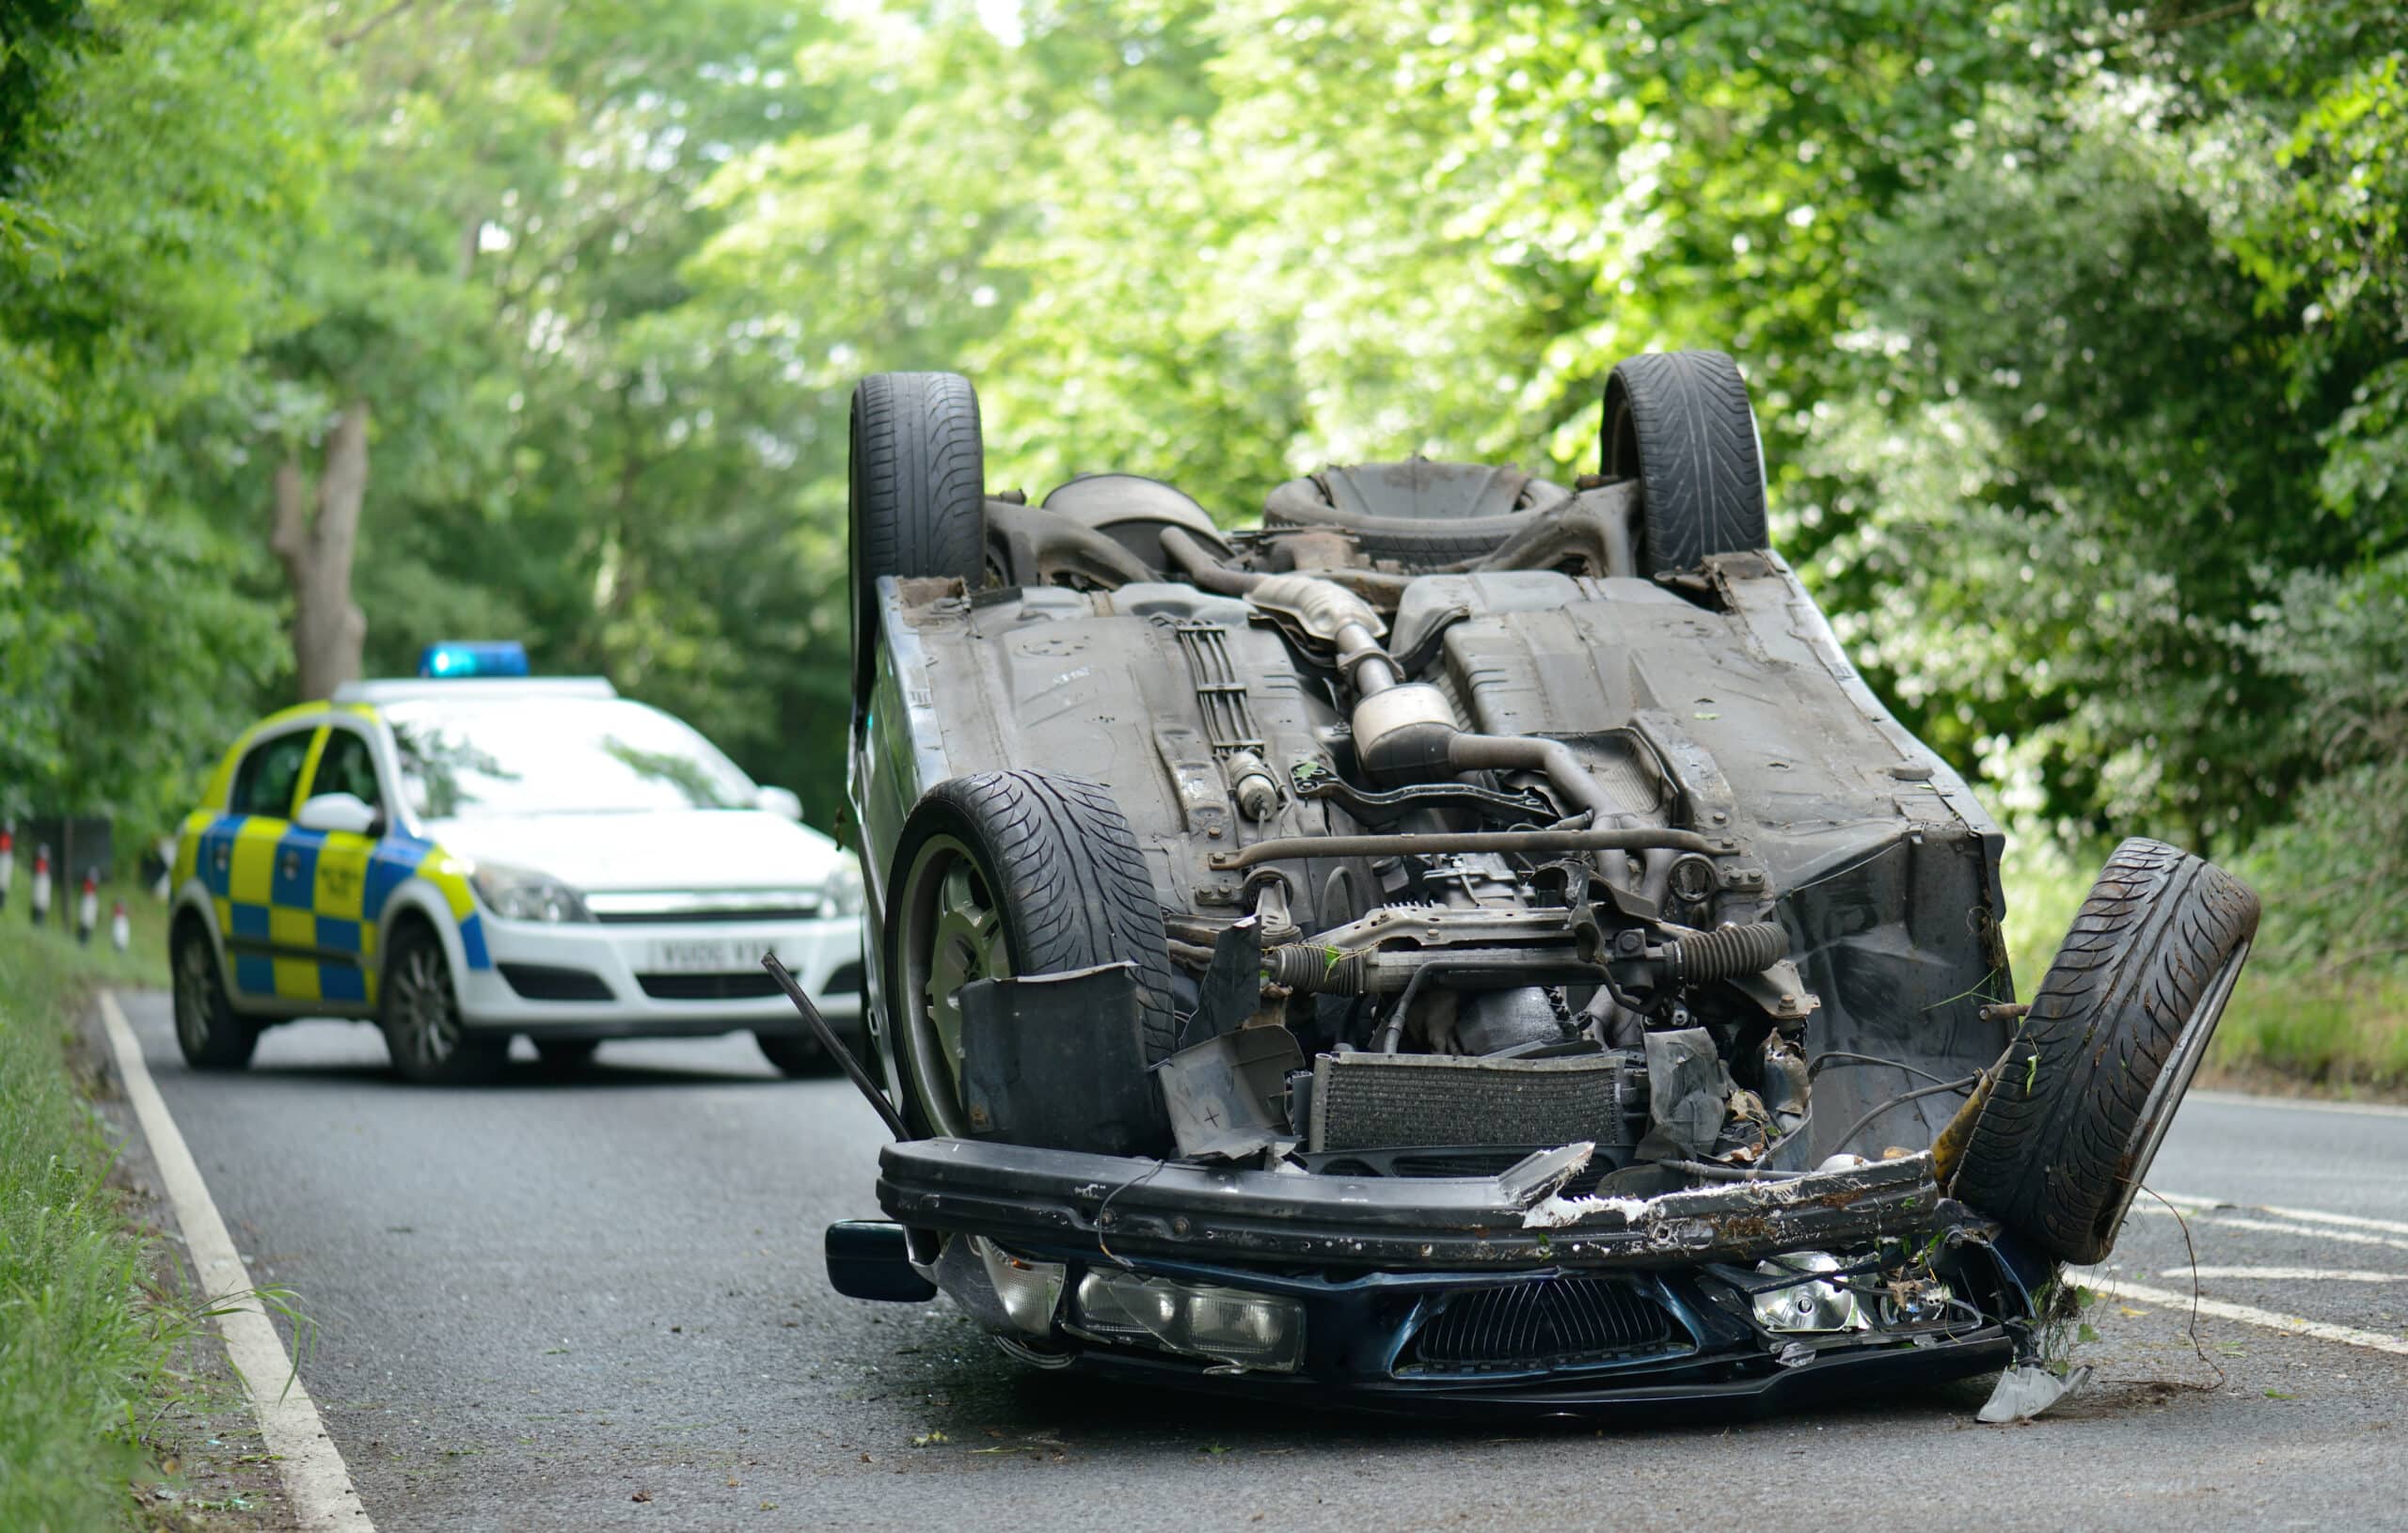
What do the latest UK car accident statistics show?
The DfT recorded 1,602 fatalities, 29,467 serious injuries, and 128,272 total casualties on Great Britain’s roads in 2024.
How many people die on UK roads each year?
The 2024 figure of 1,602 deaths represents a 5% fall from 1,695 in 2023. Including Northern Ireland, the UK total was approximately 1,671.
Provisional year-ending June 2025 data shows a further 3% decline to 1,579 fatalities, suggesting the downward trend is continuing.
How many people are seriously injured?
Serious injuries totalled 29,467 in 2024. This figure has remained broadly stable over the past five years despite falling fatality numbers.
Slight injuries made up the remaining 97,203 casualties, bringing the total reported figure to 128,272.
| Year | Deaths | Serious injuries | Total casualties |
| 2020 | 1,472 | 23,486 | 115,333 |
| 2021 | 1,558 | 25,750 | 127,967 |
| 2022 | 1,695 | 28,031 | 135,480 |
| 2023 | 1,695 | 29,121 | 133,443 |
| 2024 | 1,602 | 29,467 | 128,272 |
Source: DfT Reported Road Casualties Great Britain, Annual Report 2024.
What are the leading causes of car accidents in the UK?
Failing to look properly is the single most common factor, cited in 38% of all reported collisions. Speeding contributes to up to 29% of fatal crashes.
How common is speeding as a factor?
Exceeding the speed limit or driving too fast for conditions is a factor in up to 29% of fatal collisions. It’s one of the most common driving offence codes and carries penalties from fixed fines to disqualification.
Even small increases in speed dramatically raise the risk of death. At 30 mph, a pedestrian struck by a car has a roughly 20% chance of dying.
At 40 mph, that figure rises to around 45%. This is why speed enforcement remains central to road safety policy.
How many accidents involve drink-driving?
In 2023, an estimated 1,860 people were killed or seriously injured in collisions where at least one driver was over the legal alcohol limit. The DfT’s drink-drive statistics show casualties peaked between June and August, with over 6,800 incidents during those summer months.
Young males aged 20–24 have the highest drink-drive casualty rate of any demographic group.
| Cause | Involvement in collisions |
| Failing to look properly | 38% of all collisions |
| Exceeding speed limit / too fast | Up to 29% of fatal collisions |
| Driver distraction (inc. mobile phones) | ~15% of all collisions |
| Drink-driving | 1,860 KSI casualties (2023) |
| Careless or reckless driving | ~12% of all collisions |
| Poor weather or road conditions | ~9% of all collisions |
When do the most accidents happen?
Casualty numbers peak during the summer months, particularly between June and August when traffic volumes are highest. Friday afternoons and early evening rush hours are the most dangerous periods.
Winter months see fewer total collisions but a higher proportion of serious and fatal crashes, often linked to poor visibility, wet roads, and icy conditions.
Which road users are most at risk?
Car occupants account for 43% of all road deaths, but motorcyclists and pedestrians face far higher risk relative to their numbers on the road.
How many pedestrians are killed each year?
In 2024, 409 pedestrians were killed on GB roads, a slight increase from the previous year. Pedestrians make up around 25% of all road deaths despite representing a fraction of total road traffic.
If you’re involved in a collision as a driver, the steps you take immediately afterwards matter. Our guide on what to do after a car accident covers the legal and practical basics.
How dangerous is motorcycling compared to driving?
Motorcyclists accounted for 340 deaths in 2024, up 8% from the year before. They represent 21% of all fatalities but make up only about 1% of total road traffic.
Pedal cyclists saw 82 deaths in 2024, a 6% decrease. Serious cyclist injuries totalled 1,271.
| Road user type | Deaths (2024) | Share of total | Change vs 2023 |
| Car occupants | 692 | 43% | Down 5% |
| Pedestrians | 409 | 25% | Up 1% |
| Motorcyclists | 340 | 21% | Up 8% |
| Pedal cyclists | 82 | 5% | Down 6% |
| Other (vans, HGVs, buses) | 79 | 5% | Varies |
How do age and gender affect road safety?
Men account for 76% of all road fatalities. Young drivers aged 17–24 represent around 7% of licence holders but are involved in roughly 20% of fatal and serious collisions.
Which age groups are most at risk?
Male fatalities are highest in the 50–69 age group (342 deaths in 2024, up 23% year-on-year). For women, those aged 70 and over face the greatest risk, with 128 deaths in 2024.
Young males aged 17–29 accounted for 294 deaths. Young females in the same age group accounted for 79, a 25% increase on 2023.
Are young drivers over-represented in accidents?
Yes, drivers aged 17–24 are involved in a disproportionate share of serious crashes. Inexperience, risk-taking, and late-night driving all contribute.
Black box insurance is specifically designed to address this by monitoring driving habits and rewarding safer behaviour with lower premiums.
Around 18% of under-25s admitted to driving after drinking, up from 15% in the previous year.
Where in the UK do the most accidents happen?
Rural roads account for 58% of all road deaths despite carrying far less traffic than urban roads. Motorways account for just 6% of fatalities.
Are rural roads more dangerous than urban roads?
In 2024, 874 people were killed on rural roads. Higher speeds, narrower carriageways, and fewer safety features all contribute.
After a collision on a rural road, you may need to decide whether your car is safe to move. Our guide on driving after an accident explains what to check before getting behind the wheel again.
Which regions have the highest casualty rates?
The South East of England recorded the highest total fatality count in 2024. Scotland had 165 deaths and a higher per-capita fatality rate, partly due to its extensive rural road network.
England overall recorded 1,353 deaths, 24,697 serious injuries, and 118,546 total casualties.
How do motorways compare to other road types?
Motorways carry around 21% of all road traffic but account for only 6% of fatalities. Their design, with separated carriageways and controlled access, makes them far safer per mile driven.
Most fatal collisions happen on single-carriageway A and B roads. If your car is damaged in a collision, understanding write-off categories helps you know whether a repair or replacement is the right call.
What is the economic cost of road accidents?
Road accidents cost the UK economy an estimated £36 billion per year. This includes emergency services, medical treatment, lost productivity, and legal costs.
Road closures caused by serious collisions add a further £5 billion in annual congestion costs. The human cost, of course, cannot be measured in money.
How have UK road accident rates changed over time?
Total road casualties have fallen by around 34% over the past decade. The fatality rate per billion vehicle miles has also dropped sharply, reflecting improvements in vehicle safety and road design.
What does the long-term trend look like?
The sharpest recent drop came in 2020, when lockdowns cut traffic volumes. Deaths rose again in 2021 and 2022 as traffic returned, then fell in 2024.
| Year | Road deaths (GB) | Change |
| 2019 | 1,752 | — |
| 2020 | 1,472 | Down 16% (lockdowns) |
| 2021 | 1,558 | Up 6% |
| 2022 | 1,695 | Up 9% |
| 2023 | 1,695 | Unchanged |
| 2024 | 1,602 | Down 5% |
Despite the overall decline, serious injuries have not fallen at the same rate. Better vehicle safety has saved lives in high-speed crashes, but lower-speed urban collisions still cause lasting harm.
Even minor accidents can result in write-off classifications that affect a vehicle’s future value and insurability.
How does the UK compare to other countries?
The UK consistently ranks among the safest countries in Europe for road deaths. It sits alongside Norway, Sweden, and Denmark at the top of EU and OECD road safety tables.
Where does the UK rank internationally?
| Country | Deaths per million population |
| Norway | 16 |
| Sweden | 20 |
| Malta | 21 |
| Denmark | 24 |
| UK | 25 |
| Netherlands | 27 |
| Germany | 33 |
| France | 44 |
| USA | 128 |
The UK’s strong performance reflects decades of investment in road design, vehicle safety standards, and enforcement. MOT testing plays a direct role by keeping unsafe vehicles off the road.
For more context on international road safety data, the RAC Foundation’s safety section tracks long-term trends and policy developments.
What measures are being taken to improve road safety?
The UK government’s road safety strategy includes speed limit enforcement, infrastructure upgrades, and stricter penalties for dangerous driving.
What government initiatives exist?
Key measures include 20 mph zones in residential areas (now standard in Wales), average speed cameras on A-roads, and the Brake road safety charity‘s annual campaigns targeting drink-driving and phone use behind the wheel.
Penalties for dangerous driving have been increased, with new offence codes reflecting harsher sentences for causing death by careless or dangerous driving.
How does insurance support safer driving?
Telematics-based black box insurance rewards good driving behaviour with lower premiums. It’s particularly popular with younger drivers, who face higher base costs due to their accident statistics.
Choosing the right level of cover also matters. Understanding the difference between third party only insurance and full cover policies helps drivers decide how much protection they need.
Frequently asked questions (FAQs)
In 2024, 1,602 people were killed on Great Britain’s roads. Including Northern Ireland, the UK total was approximately 1,671.
Failing to look properly is cited in 38% of all reported collisions, making it the single most common contributory factor.
Yes, drivers aged 17–24 represent around 7% of licence holders but are involved in roughly 20% of fatal and serious collisions.
Rural roads account for 58% of all road deaths. Higher speeds and fewer safety features make them much more dangerous than urban roads or motorways.
The UK consistently ranks among the top five safest countries in Europe for road deaths, alongside Norway, Sweden, and Denmark.
Road deaths fell 5% in 2024 to 1,602. The long-term trend shows a 34% reduction over the past decade.
In 2023, there were an estimated 1,860 killed or seriously injured casualties in collisions involving an over-the-limit driver.
Men account for 76% of all road fatalities. Male drivers are over-represented in every age group and collision type.